Q3/2025
What Happened in Q3 2025
Commentary • What Happened
Date posted
Oct 14, 2025
As we step into the final quarter of 2025, it’s a great time to look back at the key market dynamics and drivers that shaped Q3. After a volatile start to the year, global equities found their footing and delivered one of the strongest quarterly performances since 2020, with major indices surging to new record highs.
The S&P 500 climbed above 6,600, while both the Nasdaq Composite and Russell 2000 posted impressive gains, the latter reaching its first record high since November 2021. U.S. equities returned between 5% and 10% for the quarter, extending year-to-date gains despite earlier concerns around tariffs and slowing economic growth. What made this rally encouraging was that gains were distributed across sectors. While technology and communication services continued to lead, driven by sustained enthusiasm around artificial intelligence, the advance broadened meaningfully beyond mega-cap tech. Mid-cap companies and infrastructure-related businesses tied to AI development participated actively, reflecting healthier underlying market momentum.
International markets joined the rally as well. Canadian equities rose more than 9%, supported by strength in financials, technology, and real estate sectors. European markets continued to benefit from improving fundamentals and attractive valuations relative to their U.S. counterparts, contributing to a robust global equity backdrop. Several factors supported this performance. Corporate earnings held up remarkably well despite mixed economic signals. More significantly, the Federal Reserve’s (“Fed”) decision to begin cutting interest rates helped restore investor confidence after months of uncertainty. In September, the Fed lowered its benchmark rate by 0.25 percentage points to 4.00%-4.25%, marking the beginning of what many expect to be a gradual easing cycle.
However, the Fed faces a delicate balancing act. While the rate cut acknowledged a clear softening in labour markets, inflation remains stubbornly elevated. Core PCE inflation, the Fed’s preferred inflation measure, rose 2.9% year-over-year in August, remaining unchanged from earlier in the year, while headline PCE came in at 2.7%. The Fed has signalled a cautious approach, projecting only two more quarter-point cuts by year-end and one additional cut in 2026.
The most concerning development in Q3 was the continued deterioration in U.S. labour market conditions. Job growth slowed dramatically over the summer, averaging just 29,000 new positions, well below the level needed to maintain stable unemployment. Making matters worse, significant downward revisions revealed the economy created nearly 900,000 fewer jobs than initially reported over the prior year, representing the largest revision since 2009.
The unemployment rate has risen from its cycle low of 3.5% in early 2023 to 4.3% in August. While this remains historically low, the speed and consistency of the increase pose some concerns for market watchers. Historically, recessions have often followed when the three-month average unemployment rate rises by roughly a third of a percentage point. Despite these trends, initial jobless claims remain subdued, and layoffs haven’t accelerated meaningfully, suggesting the labour market is cooling through reduced hiring rather than increased firing. Whether this softer adjustment can continue without tipping into more severe weakness remains an open question as we head into Q4 and 2026.
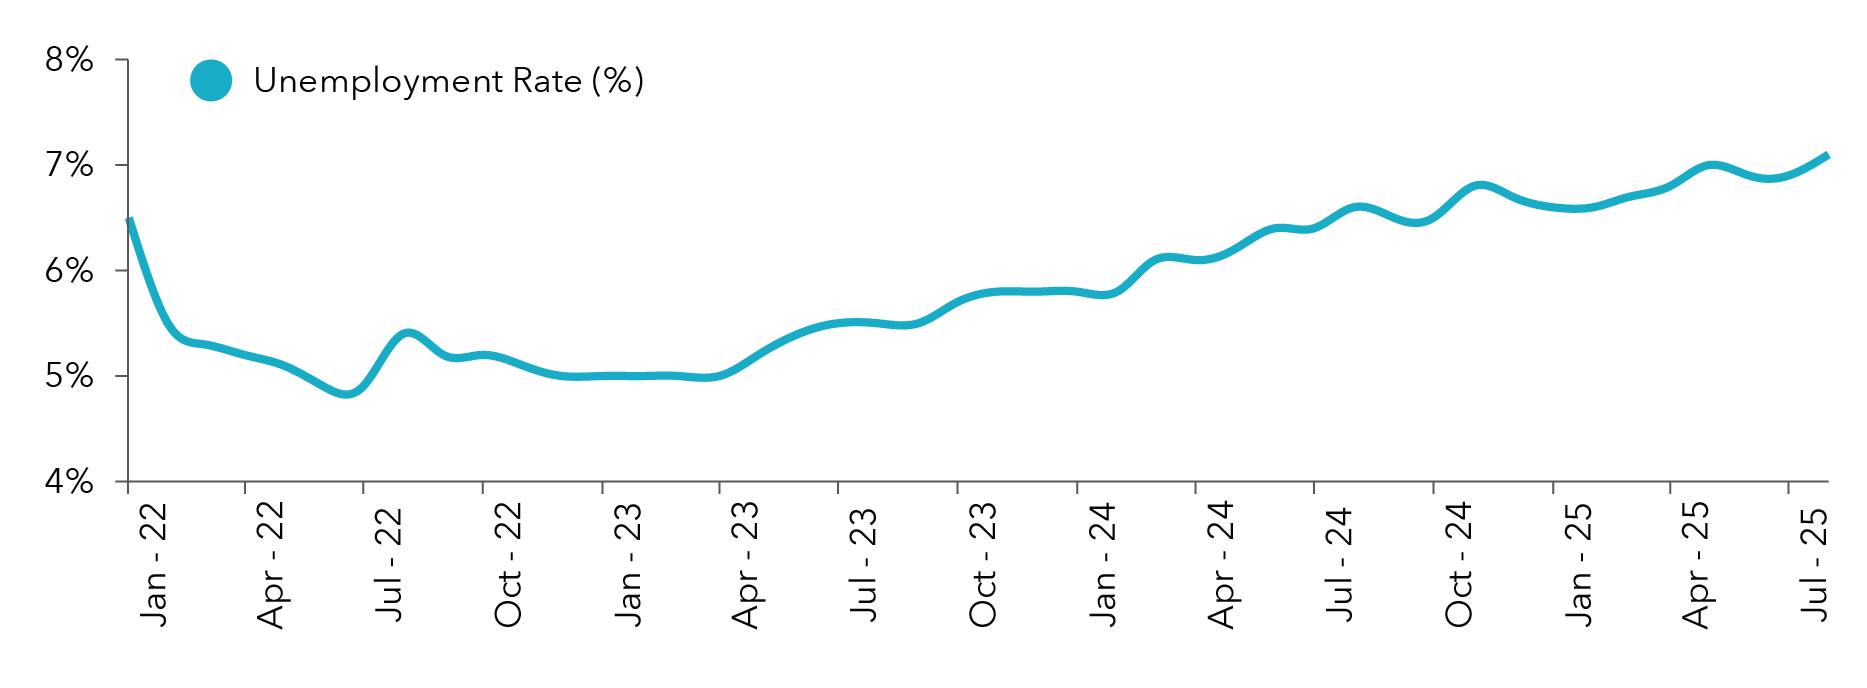
Canada’s employment picture presents a sharper contrast, with the country losing over 66,000 jobs in August alone, a concerning figure that reflects mounting economic uncertainty. Trade tensions with the U.S. have contributed to this deterioration, as illustrated in the chart below.
Chart 1: Canada Monthly Unemployment Rate (2022-2025) [1]
Client Experience
Despite broader economic uncertainties, in Q3, Kinsted’s diversified, long-term approach delivered positive results and maintained client support amid a period of market strength.
The Strategic Growth Pool posted a solid 6.3% return in Q3, driven primarily by developments within its private equity holdings. Two long-held positions, Bullish and Figure Technologies, completed successful IPOs during the quarter, with Bullish (BLSH) ending the period up 85% from its IPO price and Figure (FIGR) closing 47% higher. These exits contributed meaningfully to quarterly returns and underscore the long-term value creation potential of patient capital. Private equity valuations improved modestly from Q2, though exit activity remains selective amid ongoing macroeconomic uncertainty.
The Global Equity Pool delivered a 6.5% return, but Q3 represented an important transition period as we evolved our approach toward a predominantly passive strategy complemented by selective active and opportunistic holdings.
As the quarter closed, we successfully repositioned 50% of the pool into an alpha-generation strategy designed to deliver returns independent of traditional equity market drivers. This strategy was implemented on October 1st, marking a significant milestone in the pool’s evolution.
The Strategic Income Pool delivered relatively flat performance as several offsetting dynamics played out. While most holdings performed as expected, generating steady income and modest capital appreciation, some publicly traded positions, particularly business development companies (publicly traded credit), experienced significant drawdowns that weighed on overall results. These BDCs, which typically benefit from higher interest rate environments, faced pressure as markets began pricing in the Fed’s rate-cutting cycle. Additionally, the pool’s largest holding, a private credit investment marked only twice annually, contributed no value to quarterly performance simply due to the valuation schedule. As we approach year-end when this holding receives its next formal valuation update, we expect it to reflect the value creation that has been occurring throughout the year.
The Real Asset Pool delivered a strong quarter, advancing nearly 2.5% as strength was evident across most holdings. The standout performer was our publicly traded infrastructure ETF, which rallied over 11%, benefiting from both broader equity market strength and renewed investor interest in infrastructure assets as interest rates began declining. Private infrastructure holdings also contributed meaningfully, with most positions delivering returns in the 2.5% to 5% range consistent with expectations for stable, income-generating real assets. The broad-based nature of this quarter’s performance reinforces our conviction in real assets as a compelling diversifier and inflation hedge within balanced portfolios.
The Kinsted Bond Pool performed in line with its benchmark, posting a 1.3% return as fixed income markets responded to continuing monetary easing. This modest positive return reflected the typical inverse relationship between bond prices and interest rates. While more subdued compared to equities, this performance was entirely consistent with the role fixed income plays within diversified portfolios, providing stabilizing benefits and reduced overall portfolio volatility.
Looking Ahead
As we enter Q4 2025, we see a market environment characterized by conflicting signals. Corporate earnings remain healthy, AI-related investment continues unabated, and the Fed has begun easing monetary policy. However, labour markets are weakening, recession risks are elevated, and inflation remains above target. Against this complex backdrop, we expect continued volatility in Q4 as markets focus on trade policy, monetary policy, and corporate earnings. While results have been strong thus far, forward guidance will be closely scrutinized for signs that economic softness is affecting business fundamentals.
U.S. equity valuations remain elevated by historical standards, with the S&P 500 trading at price-to-earnings multiples near the 93rd percentile historically. This limits the margin of safety should economic conditions deteriorate, or earnings disappoint.
Chart 2: US Inflation Rate (Year-Over-Year CPI Change) [2]
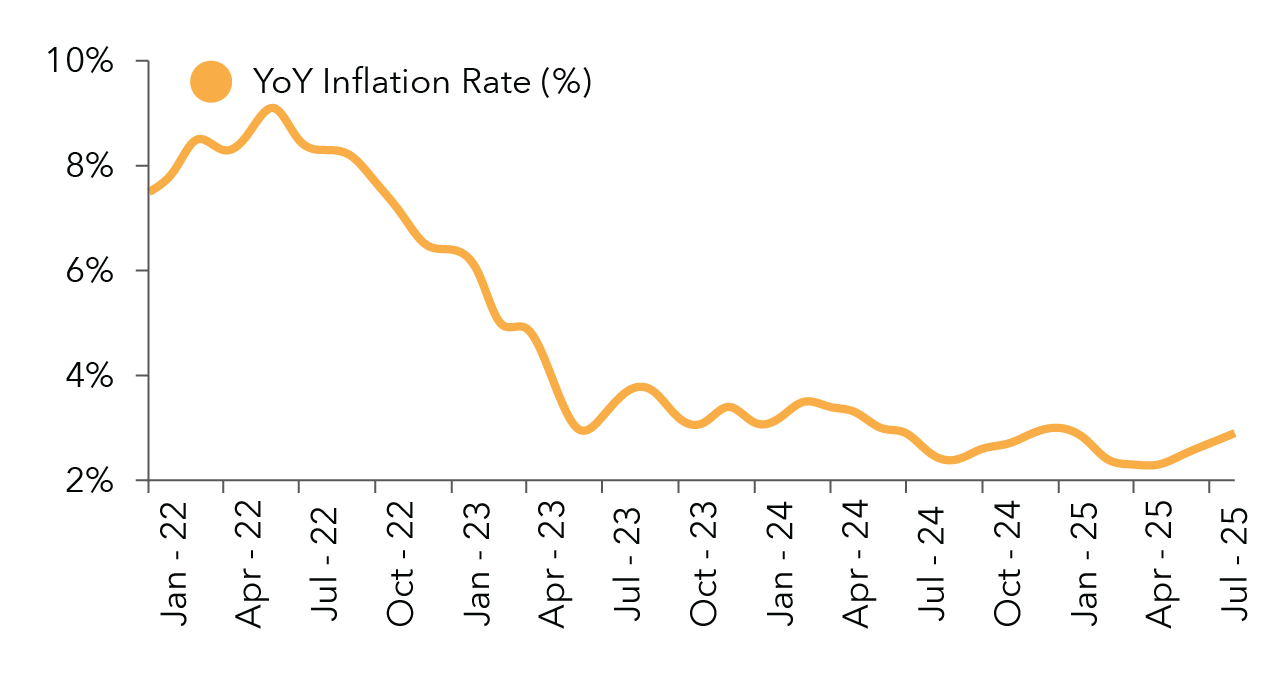
While the Fed has begun cutting rates, the pace and magnitude of future cuts remain data dependent. If the labour market continues weakening significantly, the Fed may need to ease more aggressively than currently projected. However, as the chart to the left shows, the inflation rate in the U.S. has proven stickier than expected, potentially delaying further rate cuts.
There continues to be relative value in international markets, particularly in Canada and parts of Europe, where valuations remain more reasonable than in the U.S. The Canadian market’s strong Q3 performance was supported by attractive starting valuations and domestic factors like central bank rate cuts supporting real estate and financial sectors.
Our conviction in real assets remains strong. As inflation persists above target and economic uncertainty continues, assets with pricing power and essential characteristics become increasingly valuable. Infrastructure offers defensive growth characteristics that should serve portfolios well regardless of the economic path ahead.
The third quarter reminded us that markets can surprise. After a challenging start to the year, equity markets not only recovered but surged to new highs, rewarding investors who maintained discipline through uncertainty. At the same time, the underlying economic picture has become more complex, with weakening labour markets tempering what would otherwise be an unambiguously positive story.
At Kinsted, we remain focused on constructing portfolios that can weather different economic scenarios through appropriate diversification across geographies, sectors, and asset classes. That means being selective rather than chasing recent winners and keeping your unique goals and time horizon at the center of every investment decision. Whatever comes next, we’re here to help you navigate it with confidence and clarity.
Regards,
Kinsted Wealth
[1] Source: Statistics Canada, Labour Force Survey (2022–2025).
* Monthly unemployment rate, seasonally adjusted
[2] Source: U.S. Bureau of Labor Statistics - Consumer Price Index for All Urban Consumers (CPI-U)
* January 2022-August, 2025 | Index 1982-84=100, seasonally adjusted