Investing in Volatile Times
Commentary • Education
Date posted
Dec 3, 2024
What is Volatility?
According to Themed Entertainment Association (TEA), the top 25 amusement/theme parks worldwide attracted over 240 million visitors with attendance growing year over year, many of whom come to ride the park's main attraction: roller coasters.The thrill of riding a roller coaster comes from adrenaline, the excitement of the unknown, the illusion of danger, unique physical sensations, social connection, and perhaps nostalgia. The drastic ups and downs, loops, hard corners, and unpredictable nature of the ride entice roller coaster enthusiasts to return year after year. While many people love the thrill, some don’t and prefer slower, smoother rides instead. The feeling of unpredictability, stomach-turning ups and downs, and G-forces is enticing for some but discouraging for others.
A roller coasters loops, corners, unpredictability, and ups and downs can be compared to investing. Investing involves unpredictability, significant ups and downs, and can sometimes even make your stomach feel like it’s turning inside out. In the investing world, this is referred to as volatility. Volatility is often associated with big price swings, either up or down. Simply put, volatility measures how much and how quickly the price of an asset (e.g., a stock, bond, or another investment) moves up and down over time around its average price. The larger the price changes, the greater the volatility. Conversely, if an asset has low volatility, its price stays consistent and doesn’t change much day to day.
Using our amusement park analogy, a low-volatility investment would resemble a kiddie ride with small ups and downs, gentle corners, and shorter durations, compared to the gut-wrenching ups and downs of the big roller coasters.
Volatility is often used as a measure of risk. The more volatile an investment or asset class, the greater the price movement and, in turn, the higher the risk. Because investing involves risk, some level of volatility is unavoidable. The key question is: how much volatility is an investor willing and able to tolerate? Traditional wisdom says that the greater the risk, the higher the return however this is not always the case. Like a roller coaster, the bigger the ups and downs and the sharper the corners, the greater the thrill.
Volatility in practice
The volatility of assets and indexes varies significantly. An asset like cryptocurrency experiences massive ups and downs over short periods (high volatility), while an asset like bonds is typically stable and consistent (low volatility). Depending on an investor’s objectives and goals, portfolio volatility can differ significantly based on personal circumstances.
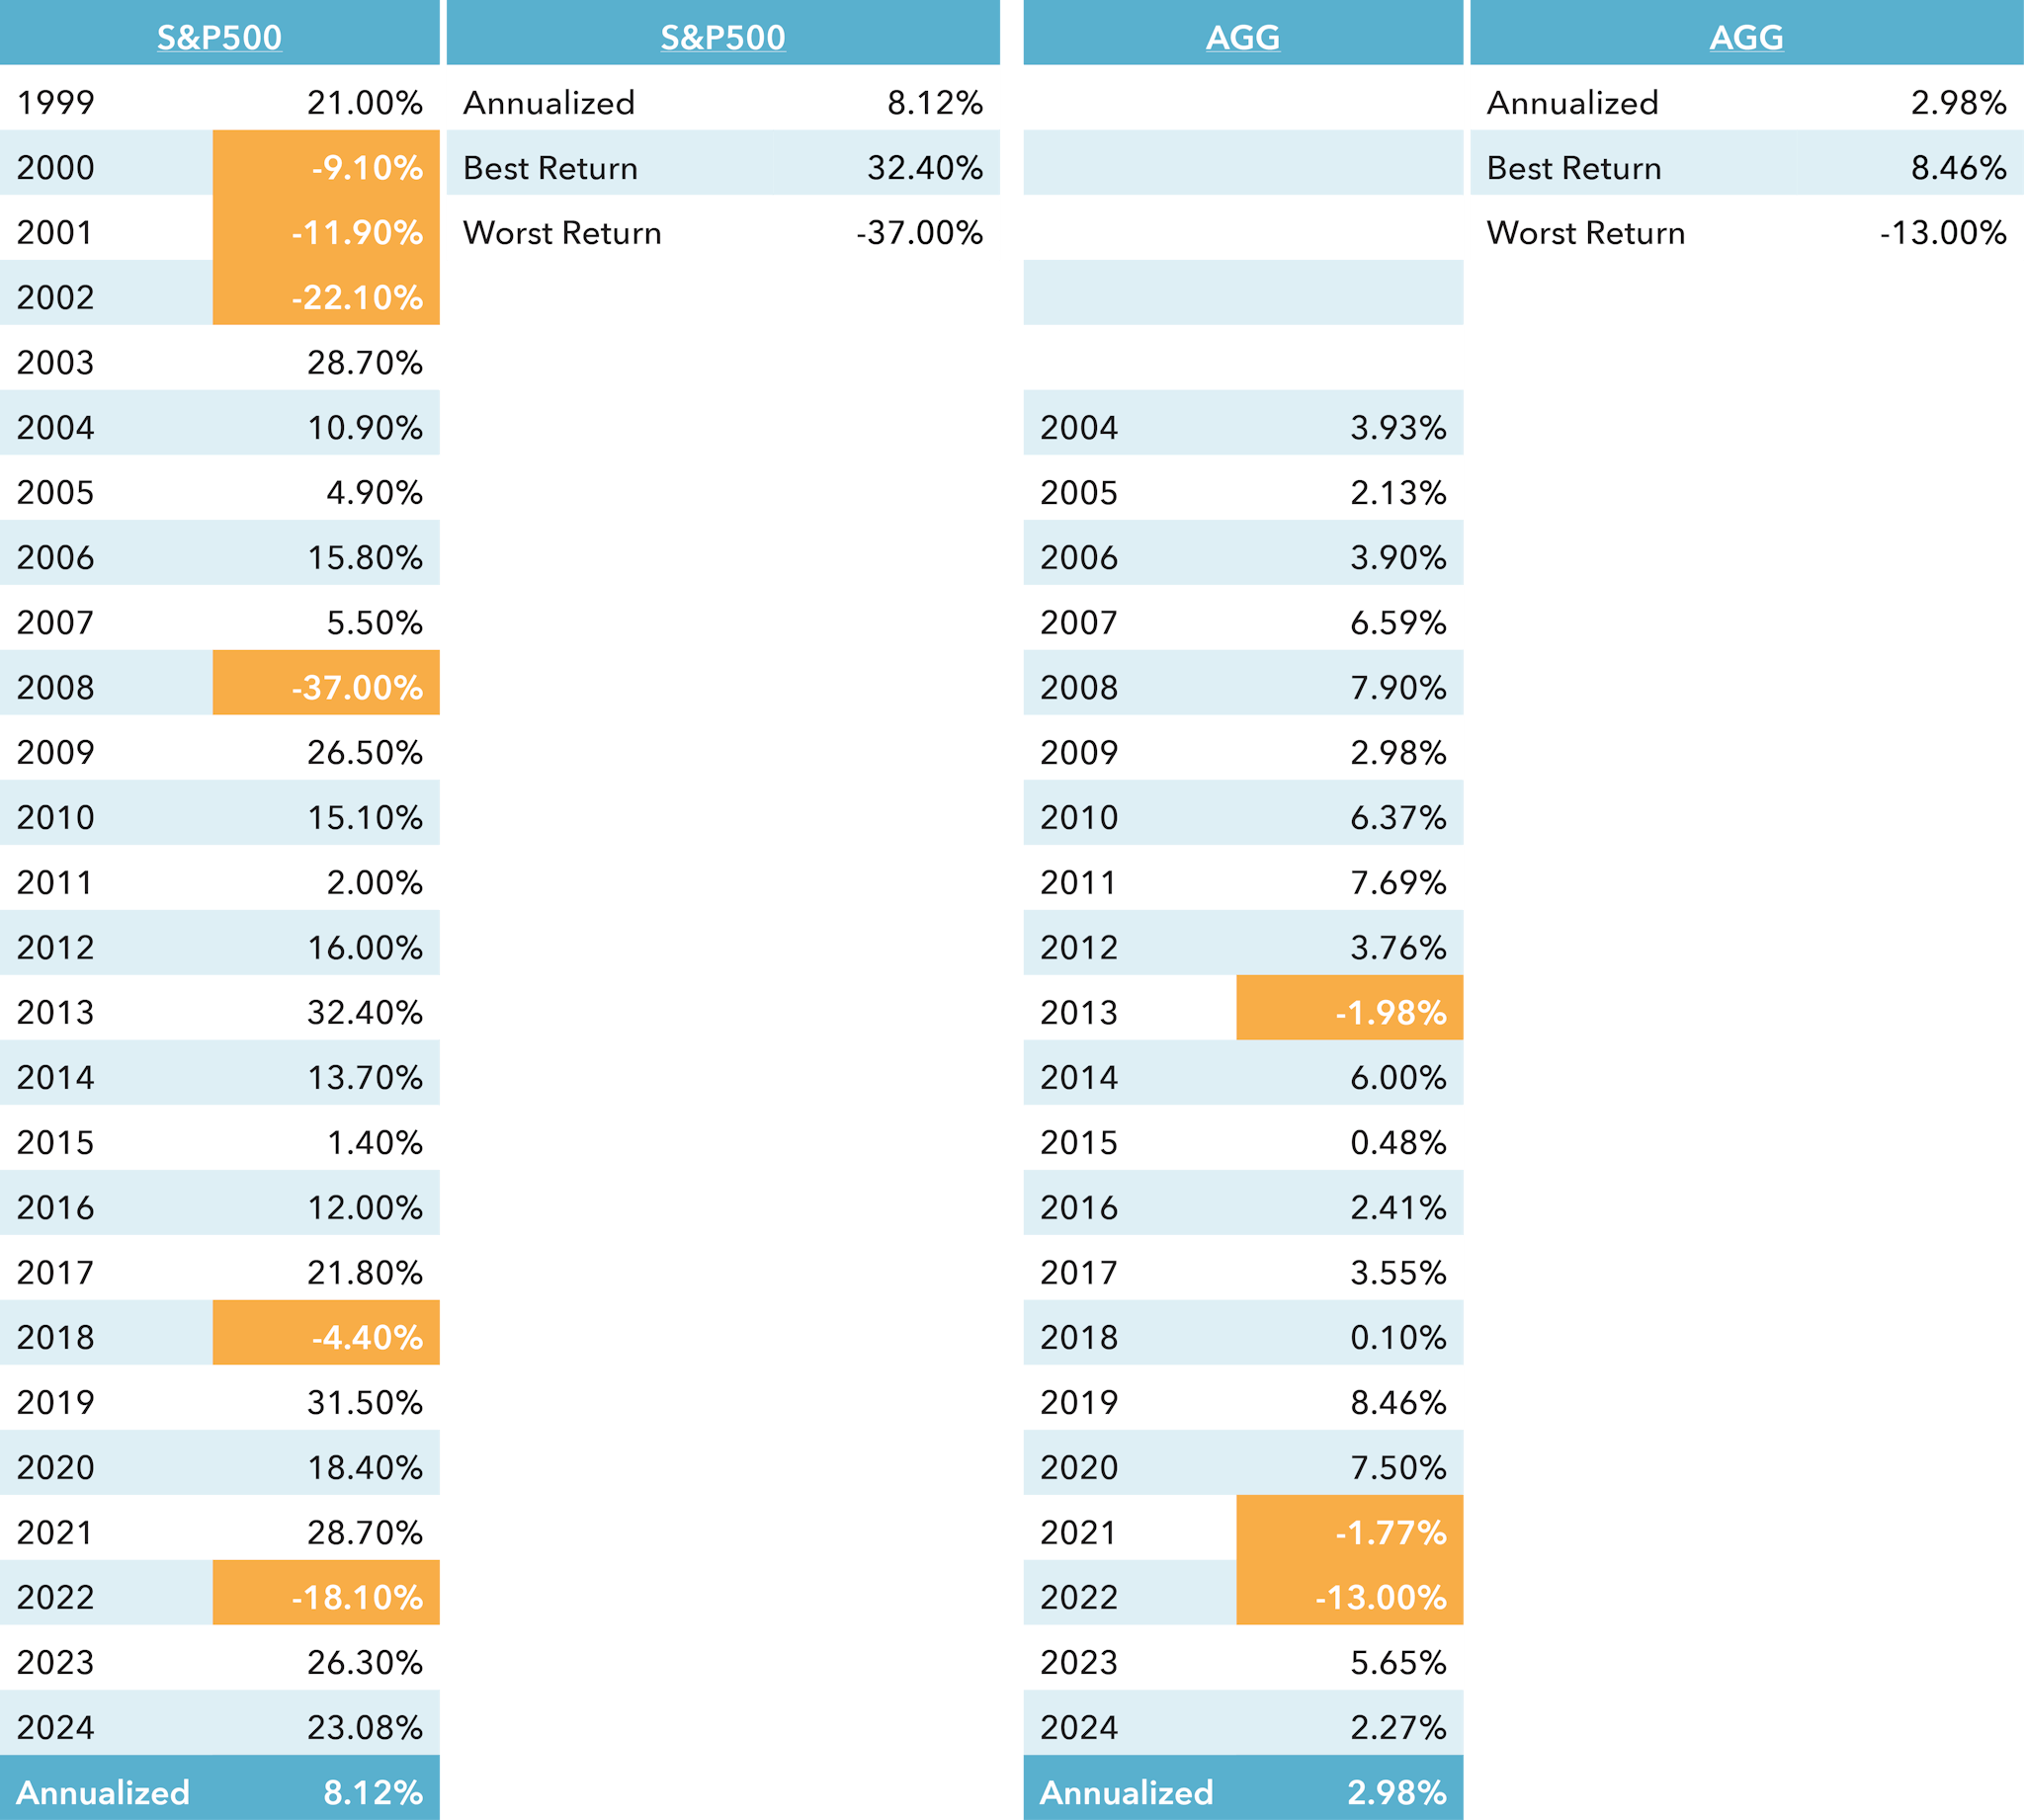
To illustrate the difference in volatility among asset classes, consider the annual returns for the S&P 500 and the Global Bond Universe (AGG).
The AGG, representing the U.S. aggregate bond market, has been more stable than the S&P 500. Its largest price swing occurred between 2022 and 2023 (from -13.00% to 5.65%).
The S&P 500 is known for its significant return swings, as seen in years like 2002–2003 (from –22.10% to 28.70%), 2008–2009 (from –37.00% to 26.50%), and 2021–2023 (from 28.70% to –18.10% to 26.30%).
S&P500 table: The table shows calendar year performance for the S&P500 over the last 25 years. Highlighted in red are negative years with the annualized performance highlighted at the bottom.
AGG table: The table shows calendar year performance for the Bloomberg Aggregate Bond Index and seeks to track the investment results of an index composed of the total U.S. investment grade bond market. Highlighted in red are negative years with the annualized performance highlighted at the bottom.
The two tables below highlight the annualized performance with best and worst years for each index. Note that the S&P500 has fluctuated significantly more than the AGG however, it has provided a much stronger return.
How to invest in volatility
The amount of volatility an investor experiences in their portfolio is a function of their desired return and risk preferences. Factors such as goals, age, knowledge, and comfort level all play a role when selecting an investment portfolio. Would you choose the big roller coaster with dramatic ups and downs, or would you prefer a smoother, more predictable ride?
For younger investors with a long-time horizon who can stomach the stock market’s big roller coaster drops, investing in volatile markets may not be a concern. However, for those who are more risk-averse or have shorter time horizons, strategies to manage volatility become critical.
Typically, everyday investors have access to two main asset classes: stocks and bonds. Stocks provide growth but come with higher volatility, while bonds offer stability and consistency (lower volatility). A balance between the two asset classes allows investors to achieve some reduction in volatility and diversification benefits but doesn’t fully solve the problem.
For investors seeking to reduce volatility, the simplest and most common solution is to increase their portfolio’s allocation to bonds. This reduces volatility but also lowers overall returns, which may not be acceptable to some investors.
Investing in alternative asset classes, such as private credit, private real estate, and private infrastructure, has the potential to limit portfolio volatility while maintaining strong returns. Allocating more to bonds stabilizes a portfolio, but accessing private market investments—like real estate, farmland, timberland, private equity, and venture capital—offers an opportunity to reduce volatility without sacrificing returns. This approach ensures investors can achieve their goals without enduring the gut-wrenching ups and downs of the big roller coaster.
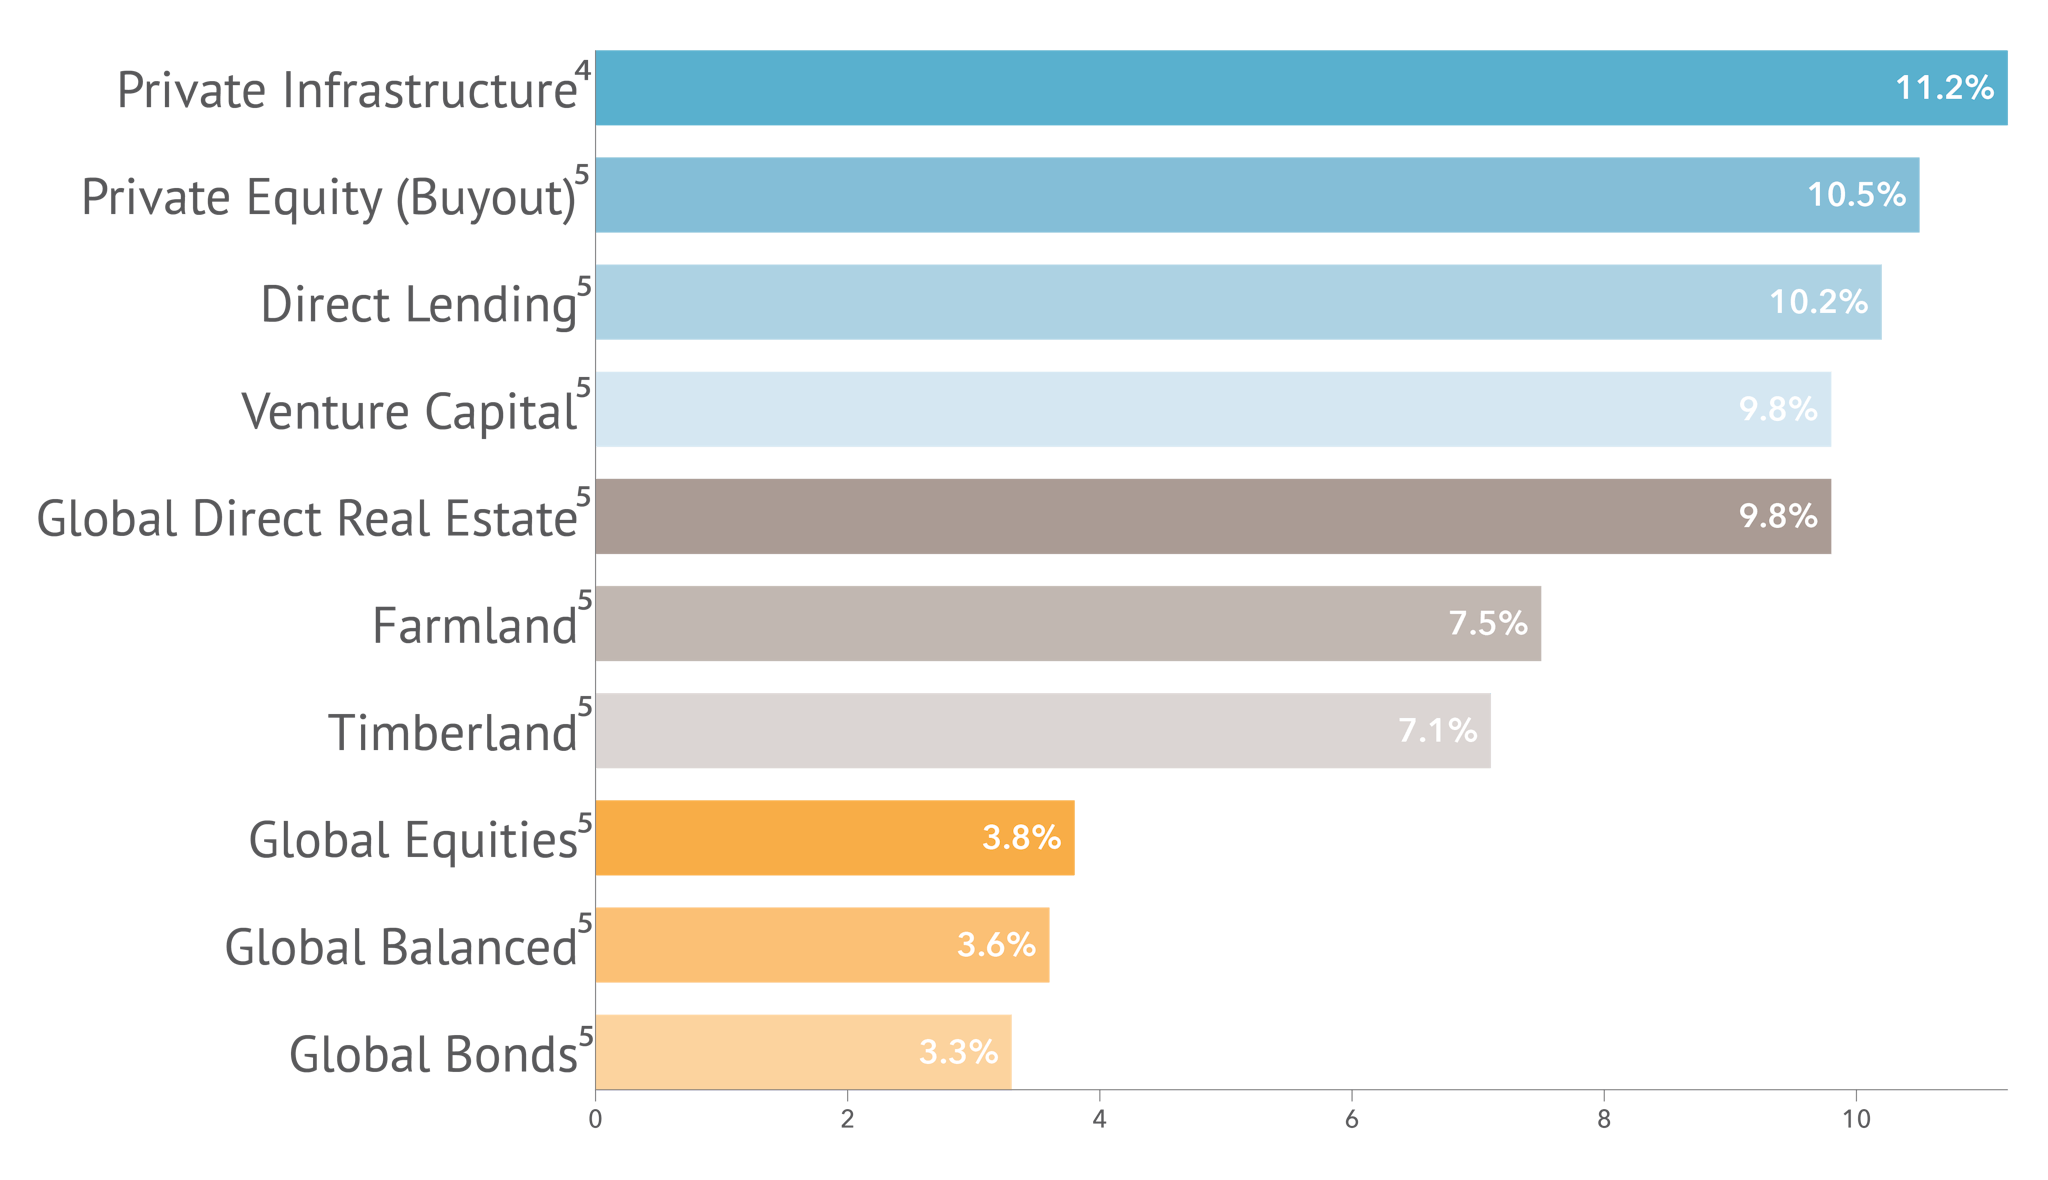
Returns from these asset classes tend to be strong for a few reasons: 1) Projected returns by analysts of these asset classes is set to do very well (See below table). 2) Investors in these asset classes tend to be institutional, meaning these investors are more sophisticated investors with very long-time horizons allowing for consistent price stability. 3) Historical long-term returns of these asset classes have been very strong.
The chart below shows the expected performance per asset class over the next 10 years according to BlackRock and BCA. Global bonds and stocks rank near the bottom of the return list, with no indication of lower volatility than their historical norms.
Kinsted provides clients with access to institutional-quality private investments that have historically reduced portfolio volatility. Combining the asset classes above in our client portfolios allows for significant diversification while providing strong returns. Each asset class plays an important and unique role in our client portfolios as we take a wholistic approach to portfolio management. Our client portfolios experience significantly less volatility than the overall stock market while maintaining strong returns.
Ready to take control of your financial future and reduce portfolio volatility while achieving your investment goals? Contact us today to learn how Kinsted can help you build a stable, high-performing portfolio tailored to your needs.
- TEA/AECOM, Robinett, J., TEA, & AECOM Economics & Advisory. (2024). GLOBAL ATTRACTIONS ATTENDANCE REPORT (By Storyland Studios, Themed Entertainment Association (TEA), & AECOM Economics + Advisory; M. Palicki, Ed.) [Report]. Themed Entertainment Association (TEA). https://aecom.com/wp-content/uploads/documents/reports/AECOM-Theme-Index-2023.pdf
- Bilello, C. (2024, November 27). The week in charts (11/26/24). Charlie Bilello’s Blog. https://bilello.blog/2024/the-week-in-charts-11-26-24
- iShares Core U.S. Aggregate Bond ETF (AGG) Performance History - Yahoo Finance. Yahoo.com. (2024). https://finance.yahoo.com/quote/AGG/performance/
- Capital market assumptions - Institutional | BlackRock. (November 2024). BlackRock. https://www.blackrock.com/ca/institutional/en/insights/charts/capital-market-assumptions
- BCA Research (2024, August 29)
Regards,
Kinsted Wealth