Algorithmic Trading: Remembering the Flash Crash
Commentary • Education
Date posted
Mar 22, 2022
Thursday, May 6th, 2010, started like any regular trading day. The markets opened down due primarily to concerns of a potential default on Greece’s sovereign debt. Many stocks and derivatives traded lower than the previous trading day. This decline continued throughout the day, when suddenly, at 2:32 PM, the Dow Jones Industrial Average started to sell off dramatically. A large sell order was executed for 75,000 E-Mini contracts on the S&P 500, valued at over $4 billion. The buyers of these contracts had now entered very large, long positions that they immediately started to sell to reduce their long side exposure. Between 2:41 PM and 2:44 PM, approximately 33% of the E-Mini daily trading volume was transacted. At 2:45 PM, market circuit breakers were triggered to halt the trading of the E-Mini contracts. However, the intense volatility spilled over into the equity markets, causing panic selling at an alarming rate.
The S&P 500 is made up of 500 stocks - all of which are part of various industry indices. When it drops, this causes the indices to re-price their index constituents lower and also causes individual securities to decline dramatically. Layered on top of all these securities are derivative contracts and stock options, which also sold off during this time. There was roughly a 10 times increase in daily stock trading volumes as traders quickly exited their positions. It is estimated that approximately 2 billion shares were traded in just under 20 minutes due to the chain reaction of re-pricing securities lower. Almost all these shares were executed at prices 10-60% from where they were trading just minutes earlier. The Dow Jones Industrial Average dropped nearly 1,000 points (9.2% decline) in under 20 minutes.
At approximately 3:00 PM that day, traders started to enter back into the market once the panic selling had died down. Nothing had changed in the world since the selling, and no new information appeared to be the cause. Cooler heads then stepped back into the market and began to buy securities at a perceived discount, not fully understanding the cause of the sudden selloff. Suddenly, the volatility was back in the market, and trading volumes increased yet again - this time, it was due to a perceived “fire sale,” and everything was trading at a significant discount. It was better than bargain Black Friday deals in the stock market, and prices quickly recovered almost all their intra-day declines. At the end of the day, the DJIA remarkably closed only 348 points lower. This event has become known in the finance industry as the “Flash Crash.”
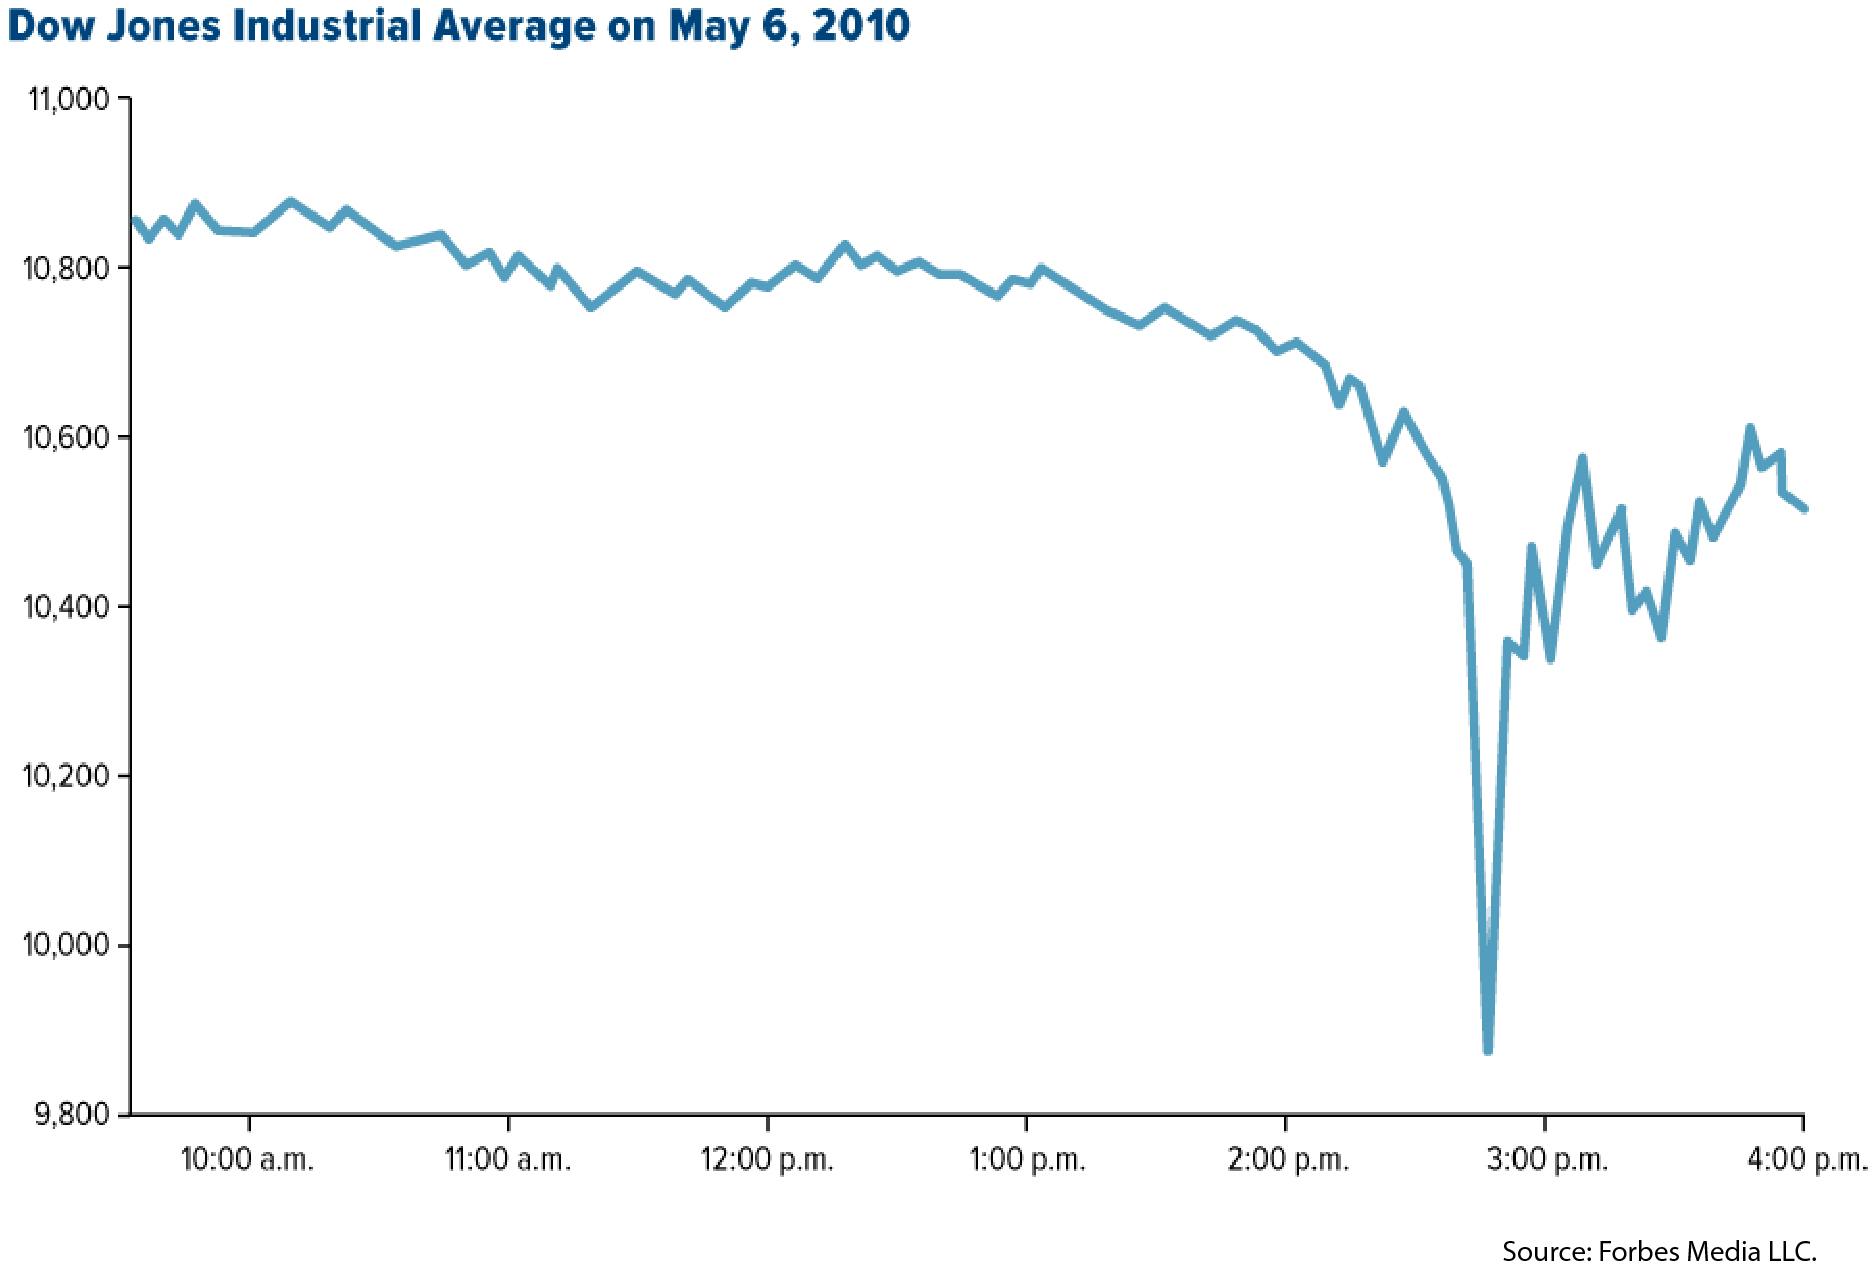
Source: CNN Business
In 36 minutes, approximately 1 trillion dollars disappeared and then reappeared as the markets dramatically fell, then almost fully recovered. You might ask what caused this Flash Crash - Algorithmic trading programs.
What is algorithmic trading?
Algorithmic trading, or “algos,” is a computer-based trading methodology of executing trades based on pre-programmed trading instructions. This type of trade execution is also known as “automated trading,” and in the case of executing trades rapidly, “high-frequency trading.” When a market event occurs, new information is released to the market, or when specific technical indicators are met, these pre-programmed trading programs execute their trading instructions. Algorithmic trading programs can recognize past trading patterns and make split-second decisions based on statistical data. As a result, trading algorithms have become very popular among investment banks, pension funds, mutual funds, and hedge funds.
And it’s not just market information these algorithms scan for; news articles, tweets, and company earnings release reports are also commonly scanned to “read” and “digest” the data faster than humans can react to this new information. Algorithms comb through endless news information outlets to piece together a narrative from which to make market directional decisions. This begs the question: do the markets still trade based on human sentiment? Or is it computers determining what they believe will be human sentiment?
History of trading algorithms
Algorithmic trading has existed in the financial markets since the early 1970s, with the New York Stock Exchange switching from its traditional order-taking system to the electronic routing of trade orders.
Currently, between 60-70% of all trades are placed and executed by computers. We can expect this to increase as the computational advantage over humans grows. As we can see from the Flash Crash in 2010, this can cause some catastrophic results. Since the Flash Crash, the U.S. Securities and Exchange Commission has thoroughly investigated and implemented several safeguards to avoid future Flash Crashes. An example of these safeguards is the implementation of circuit breakers that pause the market for five minutes if a security moves more than 10% in five minutes, giving investors time to react, digest, and reevaluate the situation before the trading algorithms get carried away.
What is inside the “black box”?
A firm’s trading algorithm is considered a “black box,” meaning the trading instructions are kept secret from other firms and their trading algorithms. Due to the proprietary nature of these programs, they are kept very confidential as each firm attempts to out-perform each other’s algorithms. It is not unusual for firms to have larger technology departments than trading desks.
Are there any benefits to algorithmic trading?
There are benefits to algorithmic trading. The most obvious benefit is the reduced trading costs by reducing the bid-ask spread (the price at which a buyer and seller would like to transact). This allows for faster and easier trade execution, making it attractive for exchanges to incorporate these algorithms into their market-making activities. Algorithmic trading can also help create market liquidity, making it easier for buyers and sellers to find a counterparty to the trade they wish to transact, ultimately helping with market efficiency. Lastly, large trade executions can be more easily broken up into more minor trade positions which can help reduce the cost of implementing the trades.
Kinsted’s Approach
Trading algorithms feed off volatility and will continue to do so. At Kinsted, our approach is to reduce the amount of public equity exposure in our clients’ portfolios and reduce the amount of exposure to these trading algorithms and short-term volatility in general. We continue to hold public equities as there are still tremendous, long-term benefits to including equities in an investment portfolio, but at the cost of more volatile short-term prices. As a Kinsted client, your is customized to an asset allocation that is tailored to your unique needs and circumstances. The amount of public equities will depend on your risk tolerance and financial goals. If you are a more aggressive investor, you can expect more exposure to the public equity markets and higher volatility levels than a conservative investor. The more exposure your portfolio has to public equity, the more exposure you will have to these trading algorithms.
At Kinsted, we do not see these market trends or increased volatility through trading algorithms decreasing in the future. For this reason, we look to the private markets as a way to reduce volatility and at times, the irrationality of the public markets. The private markets have their own risks but tend not to experience market events such as the “Flash Crash” of 2010 due to the absence of algorithmic trading. At Kinsted, we focus on diversifying across asset classes, including the public and private markets, so our client portfolios can weather a financial downturn and longer-term trends in the market.
If you’re looking for a way to diversify your portfolio further while reducing your risk and volatility, reach out to one of our Wealth Counsellors today.
References:
Algorithmic trading - Wikipedia. (2015). Retrieved 15 January 2022, from https://en.wikipedia.org/wiki/Algorithmic_trading
Kolchin, K. (2020). The 10th Anniversary of the Flash Crash - SIFMA. Retrieved 15 January 2022, from https://www.sifma.org/resources/research/10th-flash-crash-anniversary/
The Plain Bagel (2020). High Frequency Trading and its Impact on Markets. Youtube video, 11:53. March 20, 2020. https://www.youtube.com/watch?v=zi78J-h1XgY&t=544s
Twin, A. (2010). CNNMoney.com Market Report - May. 6, 2010. Retrieved 15 January 2022, from https://money.cnn.com/2010/05/06/markets/markets_newyork/
Vpro Documentary (2012). Flash Crash 2010 | VPRO Documentary | 2011. Youtube video, 48:22. December 13, 2012. https://www.youtube.com/watch?v=aq1Ln1UCoEU