Risk Premiums Explained
Commentary • Education
Date posted
Feb 18, 2025
This post is part of Kinsted’s ongoing series exploring key investment principles that shape our approach to building resilient portfolios.
For investors to take on any type of risk they should be compensated with a higher return than they could get with a risk-free investment. This additional return is referred to as the “risk premium” of an asset. The higher the risk, the higher the expected or required return. The “equity risk premium” (ERP) is the most commonly followed; however, every asset class has a risk premium attached to it.
The “risk-free” rate is the rate of return on an investment that has no risk. The 30-day T-bill rate (currently 2.9% in Canada[1]) is normally used by individual investors because T-bills (Treasury bills) are short-term government securities with virtually no risk of default. For longer-term institutional investors, the risk-free rate is often represented by the yield on the 10-year government bond, which is currently 3.1% in Canada.[1]
Using these two concepts, the risk premium formula is quite simple:
- An asset’s risk premium = the expected return on the asset less the current risk-free rate.
The expected return on asset classes considers many variables including widely accepted capital market assumptions. These are long-term projections from major institutions, asset managers, and economic forecasters that estimate future returns, risk levels, inflation, and other key market conditions.
The "risk premium" among asset classes is evident by their average returns over the long term as they are self-correcting. The concept of self-correcting in an open market is relatively simple (refer to the Kinsted blog Reversion to the Mean): if an asset’s current risk premium gets too low (i.e. the investor isn’t being compensated for the level of risk they are taking) investors will replace it with another asset. This selling pressure reduces (“corrects”) the price to an acceptable level for investing in that asset going forward. The same is true when the risk premium gets too high – buying pressure for that asset will increase the price of that asset until its risk premium gets to a more reasonable (lower) level.
Relative Risk Premiums Among Asset Classes
The problem with risk-free investments is they provide the lowest return over time, especially after tax. Therefore, if you want a higher return on your investments, you need to take on some form of risk to get that “risk-premium”.
Diversifying within an asset class helps protect the portfolio from the risk of losing capital due to the poor performance of a single investment. Therefore, the primary risk of an asset class is its volatility, or price changes, as measured by standard deviation. In other words, how much does the asset class fluctuate (or deviate) around its long-term average return?
For example, one standard deviation measures how much returns typically vary from the average, covering about 68% of expected outcomes. Two standard deviations capture the range of returns about 95% of the time. The higher the standard deviation, the higher the risk. In practice you can never capture 100% of the range of returns. The average return plus one standard deviation gives you the maximum return you would expect, at least 68% of the time, while the average return minus one standard deviation will give you the minimum you would expect 68% of the time.
The table below reflects long-term average returns, risk premiums and standard deviations for asset classes available to investors. Nominal returns are the total profit or loss before accounting for taxes, fees, or inflation.
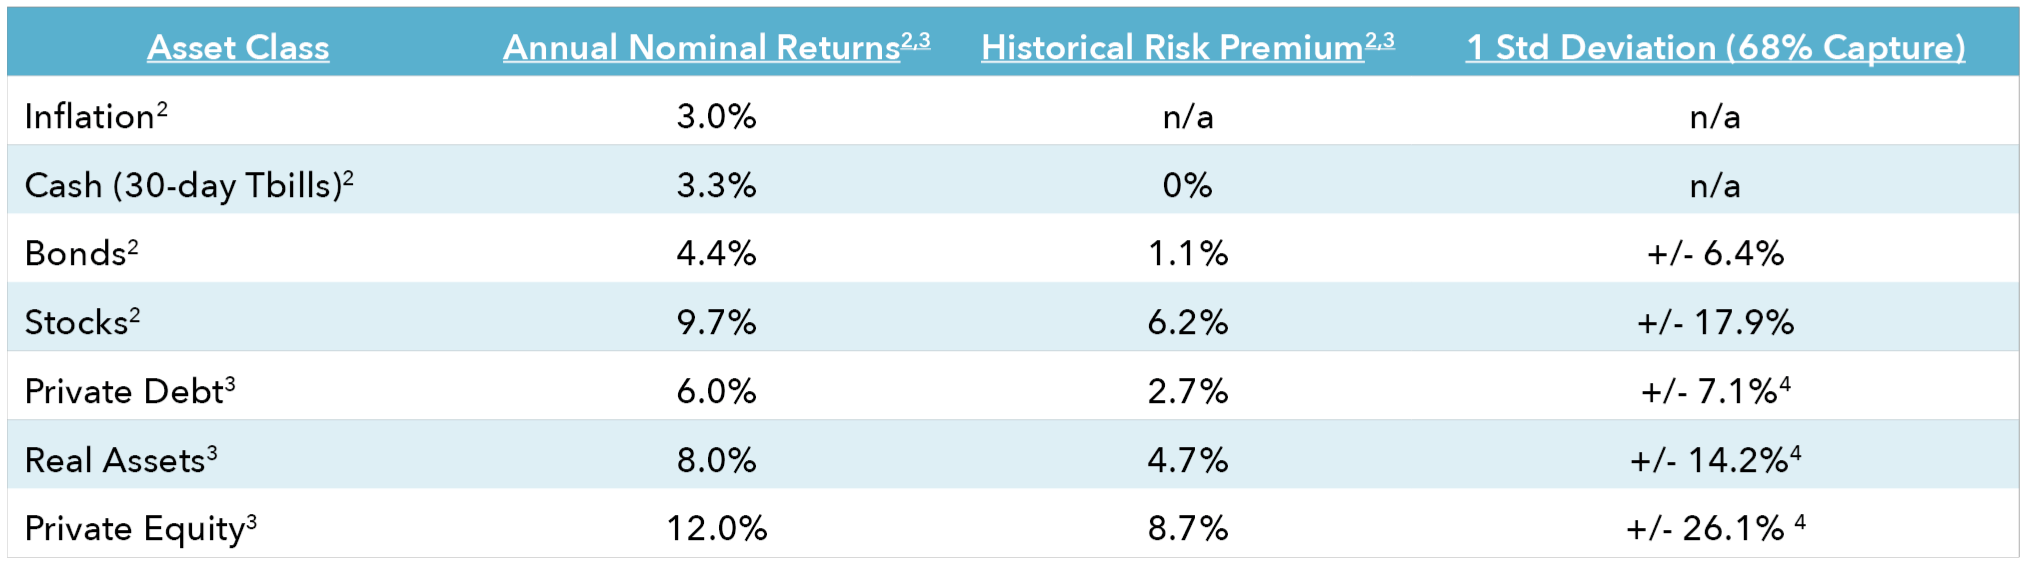
The above risk premiums inherently make sense:
- Fixed income investments like bonds should provide a slight risk-premium over cash for taking on term, reinvestment, and interest rate risk.[5]
- Public stocks should provide a healthy risk premium for investors to take on the volatility risk of holding a stock.
- Private debt, private real estate, infrastructure, and agriculture should provide a risk premium over fixed income due to being illiquid and from the size premium (usually $5-$10 million USD minimum investment).[6]
- Private equity should provide an illiquidity and size premium over public equities.
One of Kinsted’s key advantages is that we reduce or eliminate illiquidity risk. We provide our clients with daily liquidity while receiving the “illiquidity premium” on our private assets. Studies and empirical evidence indicate this illiquidity premium averages 30% more.[7]
What are the Risk Premiums Now?
Kinsted believes the risk premiums are still adequate for all the above asset classes except US public equities. The chart below illustrates that investors should expect below 0% returns above the risk-free rate for investing in US stocks going forward. This hasn’t occurred since 2007 (before the financial crisis) and 1999 (before the collapse in technology stocks).

“…the ERP is collapsing. By some gauges it is the lowest in almost a quarter of a century, and has even slipped into negative territory. If the 10-year Treasury yield continues rising, the ERP is liable to shrink even further
Risk premiums are one metric that can be used when considering investing in a security or asset class to assess the risk versus return benefits. They drift and may be out of balance at any single point in time, like bonds in late 2021, but are useful when looking at markets and opportunities over time.
Kinsted’s investment platform attempts to capture risk premiums while managing the additional risk by diversifying into institutional-quality private debt, private equity, infrastructure, agriculture, and private real estate, along with public stocks and bonds, to provide stable long-term returns sufficiently above the risk-free rate. If you’re looking to enhance your portfolio’s stability and returns, contact us to learn how our investment strategies can help you navigate today’s markets with confidence. Reach out to our team today to explore your options.
[1]TRADING ECONOMICS. (n.d.). Canada 10-Year Government Bond Yield - Quote - Chart - Historical data - news. https://tradingeconomics.com/canada/government-bond-yield
[2]We are using US data from 1928 - 2024 for the public markets because they are longer-term and have more robust data. The currency is irrelevant when relating to the concept of premium spreads. Source: Aswath Damoraran, NYU, https://pages.stern.nyu.edu/~adamodar/New_Home_Page/datafile/histretSP.html
[3]Kinsted’s estimated returns and risk premiums are based on proprietary analysis and research from various sources including Hamilton Lane, Blackstone, Blackrock, Apollo, Morgan Stanley.
[4]Standard deviation over 5-years: bonds – FTSE Canada Universe Bond Index; Stocks - MSCI World Index; Private Debt - Morningstar LSTA US Leveraged Loan TR USD; Real Assets - S&P Real Assets Index; Private Equity - S&P Listed Private Equity Index (TTM); all as of Dec 31, 2024. . Note: Kinsted Private Asset Pool funds standard deviation have been dramatically lower than the industry averages since 2019 – quite outstanding!
[5]Term risk - the longer you lock in an investment, the higher the risk will be of uncertainties occurring. Reinvestment risk - the risk of interest rates being lower at maturity. Interest rate risk - the change in the price of a bond due to changes in interest rates before the maturity date.
[6]Illiquidity risk - investors have to wait to access their money; this could be for a month, 6 months, or until the investment matures or exits. Size premium – some asset classes require larger amounts of money to invest in them.
[7]Various studies from Hamilton Lane, Blackstone, Blackrock, Apollo, Morgan Stanley
McGeever, J. (2025, January 13). Sinking Us Equity Risk Premium Rings alarms | Reuters. https://www.reuters.com/markets/us/sinking-us-equity-risk-premium-rings-alarms-mcgeever-2025-01-10/
Regards,
Kinsted Wealth